+1 445-266-1603
 +91 96504 08093

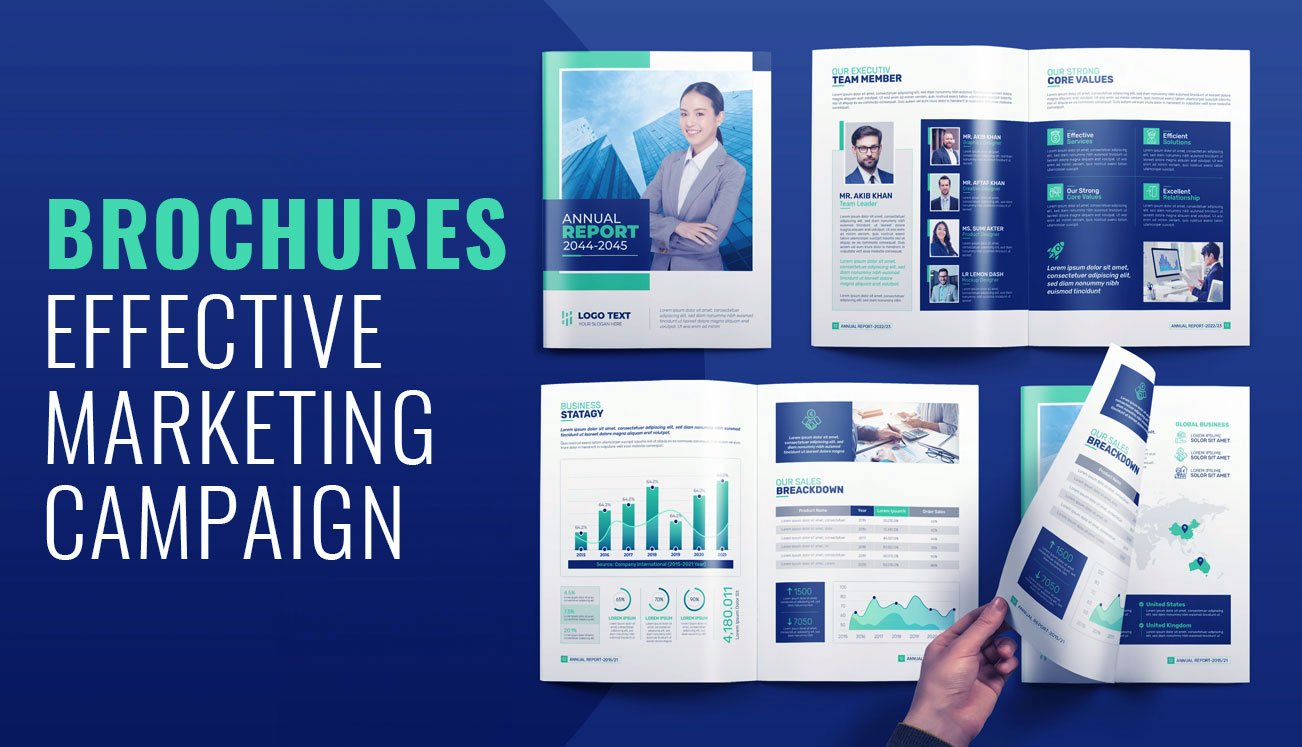
Design , Design Agency , Infographics
Latest Infographic Design Trends for 2023: Tips to Drive Business Growth

Infographics are visual representations of data or information designed to make complex information easy to understand and visually engaging. They are an effective way to communicate complex ideas, statistics, or other types of data in a format that is easy to read and interpret. Infographics have become a popular tool for businesses and organisations to convey complex information in a visually appealing and easily digestible format. As we move into 2023, the trends in infographic design are evolving to meet consumers’ changing needs and preferences. In this blog post, we will explore the top infographic trends for 2023.
Top Infographics trends for 2023

1. Interactive Infographics.
Interactive infographics are becoming increasingly popular as they allow users to engage with the content in a more immersive way. These infographics often include clickable elements, animations, and other interactive features that can help users understand the information better. Interactive infographics are a great way to increase user engagement and create a memorable experience for your audience.

2. Minimalistic Design
In 2023, we will see a trend towards minimalistic design in infographics. This means using fewer colours, simpler shapes, and more negative space. Minimalistic design can help draw the user’s attention to the most critical information while creating a clean and modern look.

3. Infographic Videos
Infographic videos are becoming increasingly popular as they can convey complex information in a highly engaging and entertaining format. These videos often use animation to help illustrate the key points and can be shared across social media platforms, making them an excellent tool for driving engagement and traffic to your website.

4. Data Visualization
In 2023, we will see a continued emphasis on data visualisation in infographics. This means using graphs, charts, and other visual elements to help illustrate complex data in a way that is easy to understand. Data visualisation can be a powerful tool for communicating complex information quickly and effectively.

5. Personalisation
As consumers continue to demand more personalised experiences, infographics are no exception. In 2023, we will see a trend towards personalised infographics catering to individual users’ unique interests and preferences. This could include customised charts, graphs, or infographics tailored to a user’s location or demographic.
In conclusion, the trends in infographic design are continually evolving to meet consumers’ changing needs and preferences. By incorporating these top trends into your infographic design, you can create engaging, visually appealing, and memorable experiences for your audience in 2023 and beyond.
Infographics are liked and shared on social media 3x more than any other type of content. (Source: Hubspot)
Why you need Infographics
Infographics are important for content marketing and social media marketing for several reasons, and you will get the following benefits if you use them in your content marketing:
1. Visual Appeal:
Infographics are visually appealing and attract attention. They are more likely to be shared on social media than plain text articles or reports, which can help increase your content’s reach and visibility.
2. Increased Engagement:
Infographics are easy to read and understand, which makes them more engaging than long-form content. They are also more likely to be shared and commented on, which can help to increase engagement and build brand awareness.
3. Improved Retention:
Infographics are easier to remember than text-based content. Research has shown that people remember visual information more easily and for longer than text-based information.
4. Increased Traffic:
Infographics can help to drive traffic to your website or social media profiles. When an infographic is shared, it often includes a link back to the original source, which can help to increase traffic to your website.
5. Improved SEO:
Infographics can also help to improve your search engine rankings. When an infographic is shared and linked back to your website, it can help to improve your website’s authority and relevance in the eyes of search engines.
Content with relevant images gets 94% more views than content without images. (Source: Jeff Bullas)
What kind of Infographics work on Social Media Marketing and Content marketing
When it comes to sharing infographics on social media, there are a few formats that tend to work well:
1. Vertical, landscape or square layouts:
Social media platforms like Instagram, TikTok, and Pinterest favour vertical or square form content, as it takes up more screen real estate and is easier to consume on mobile devices. So, a long, vertical or square layout with engaging visuals and concise text is more likely to catch the eye of social media users scrolling through their feeds.
2. Bite-sized Information:
Social media users have short attention spans, so presenting information in bite-sized chunks is essential. Use simple graphics, bold headlines, and short text snippets to convey your message quickly and effectively.
3. Branded Design:
Infographics that are branded with your company’s colours, logo, and other visual elements can help increase brand recognition and create a cohesive look across all your social media channels.
4. Animation:
Animated infographics can be particularly effective on social media, as they can capture the attention of users and convey information more engagingly. Short animated clips or GIFs can be used to highlight key points and draw the viewer’s eye to important information.
5. Shareability:
Finally, it’s important to create shareable infographics. Include social media sharing buttons, and make sure the infographic is optimised for each platform. This can include creating different versions of the same infographic with different dimensions and layouts for each platform. You can increase your reach and engagement on social media by making your infographics easy to share.
Infographics can increase web traffic by up to 12%. (Source: Demand Gen Report)
Quality of Infographic Designs:
The quality of an infographic can have a significant impact on its effectiveness and the message it conveys to the audience. Here are some key factors that contribute to the quality of an infographic:
1. Visual Appeal:
A high-quality infographic with clear, eye-catching graphics and a cohesive design should be visually appealing. Use a consistent colour scheme, typography, and layout to create a professional and polished look.
2. Clarity and Readability:
The information presented in the infographic should be clear and easy to read. Use simple, concise language, and organise the content logically to help the audience understand the information more easily.
3. Accuracy:
The information presented in the infographic should be accurate and reliable. Use credible sources and fact-check the information thoroughly to ensure its accuracy.
4. Relevance:
The information presented in the infographic should be relevant to the audience and provide value. Ensure the content is tailored to the audience’s needs and interests and provides insights they may not have previously known.
5. Storytelling:
A high-quality infographic should tell a compelling story and engage the audience. Use narrative techniques, such as a beginning, middle, and end, to create a sense of flow and coherence.
6. Shareability:
A high-quality infographic should be easy to share on social media and other platforms. Include social sharing buttons, and make sure the infographic is optimized for different platforms to increase its shareability.
A high-quality infographic should be visually appealing, precise, accurate, relevant, engaging, and shareable. By focusing on these key factors, you can create an infographic that effectively communicates your message to the audience and achieves your goals.
Infographics are 30x more likely to be read than text articles. (Source: Visually)
The cost of Infographic Design
The cost of infographic designs can vary depending on several factors, such as the complexity of the design, the amount of research required, the level of customisation, and the experience of the designer. Here are some typical price ranges for infographic design:
1. DIY Infographics:
Creating an infographic yourself using free online tools and templates can be an affordable option, as it does not require hiring a professional designer. The cost of DIY infographics is typically limited to the time and effort you invest in creating the design.
2. Template-based Infographics:
Using pre-made templates or purchasing a customizable template can be a cost-effective option for creating infographics. Prices for templates typically range from $10 to $100, depending on the level of customisation and the quality of the design.
3. Freelance Designers:
Hiring a freelance designer can be a cost-effective way to get a high-quality infographic design. Prices for freelance infographic design services typically range from $200 to $500, depending on the design’s complexity and the designer’s experience.
4. Design Agencies:
Working with a design agency can provide a higher level of customisation, design options, quick turnaround and quality, but it can also be more less expensive than freelance designer. They have all level of expertise and their pricing depends on the resources utilised in that particular projects. Prices for infographic design services at agencies typically range from $200 to $2,000, depending on the scope of the project and the level of customisation required.
Overall, the cost of infographic design can vary widely depending on the project’s specific needs. It’s essential to determine your budget and the level of customisation required before choosing a design option. It’s also essential to choose a designer or agency with experience creating high-quality infographics and a portfolio demonstrating their expertise in the field.
Infographics can increase the time spent on a webpage by up to 3x. (Source: WebpageFX)
How Infographic Design Company can help the business grow
An infographic design company can help grow a business in several ways:
1. Professional Design:
Infographic design companies have experienced designers who can create high-quality infographics that are visually appealing, engaging, and effective in communicating complex information. Professional design can help build trust and credibility with potential customers, leading to increased sales and revenue.
2. Customization:
Infographic design agencies can customise the design to suit the specific needs and goals of the business. This can help ensure that the infographic is tailored to the target audience and the desired outcome, whether to increase brand awareness, generate leads, or drive sales.
3. Research and Data Analysis:.
Infographic design agencies can conduct research and data analysis to gather the information needed to create a compelling infographic. This can help to ensure that the data presented in the infographic is accurate, relevant, and compelling.
4. Marketing Strategy:
Infographic design agencies can help businesses develop a comprehensive marketing strategy incorporating infographics as a key element. This can include social media, email, and content marketing, among other tactics.
Looking for a professional infographics design company that can take your data and transform it into stunning visuals that communicate your message effectively? Look no further than Visual Best!
At Visual Best, we are passionate about creating visually appealing and informative infographics that engage and inspire your target audience. With our years of experience in the industry, our team of talented designers has the skills and expertise to bring your data to life, whether you’re looking to create an infographic for marketing, education, or any other purpose.
Contact us today to learn more about our services and how we can help you achieve your goals!