Creative Retainer , Report Design , Social Media Marketing , Strategy
From Annual Report to Social Media Campaign: How to Turn One Asset Into Twenty
Here’s a scenario that plays out in almost every corporate marketing department each year.
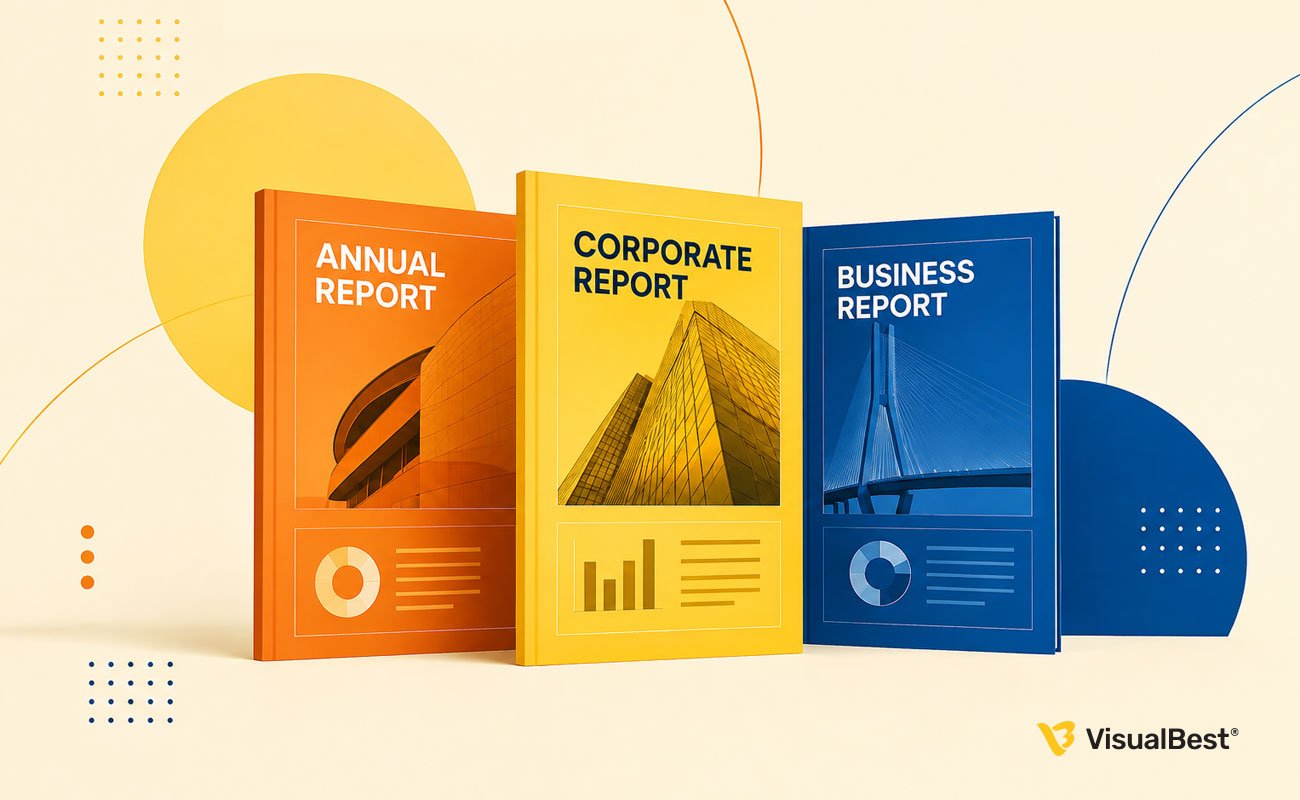
The company spends ₹15 to ₹25 lakh producing its annual report. Six months of work. Multiple review cycles. The CFO’s approval. The CEO’s approval. Board sign-off. Photography. Data visualization. Copywriting. Design. Print production for the physical version. Digital layout for the PDF. It launches with a LinkedIn post from the CEO, gets 47 likes, and disappears into the investor relations page where fewer than 200 people will ever open it.
Meanwhile, three teams down the hall, the social media team is under pressure to produce 20 posts a month. They’re running out of content ideas. They just briefed a design agency to create infographics from scratch. They’re paying ₹40,000 to ₹1,20,000 monthly for content that already exists, in gorgeous, board-approved, brand-perfect form, sitting in a PDF nobody opens, less than 100 metres away.
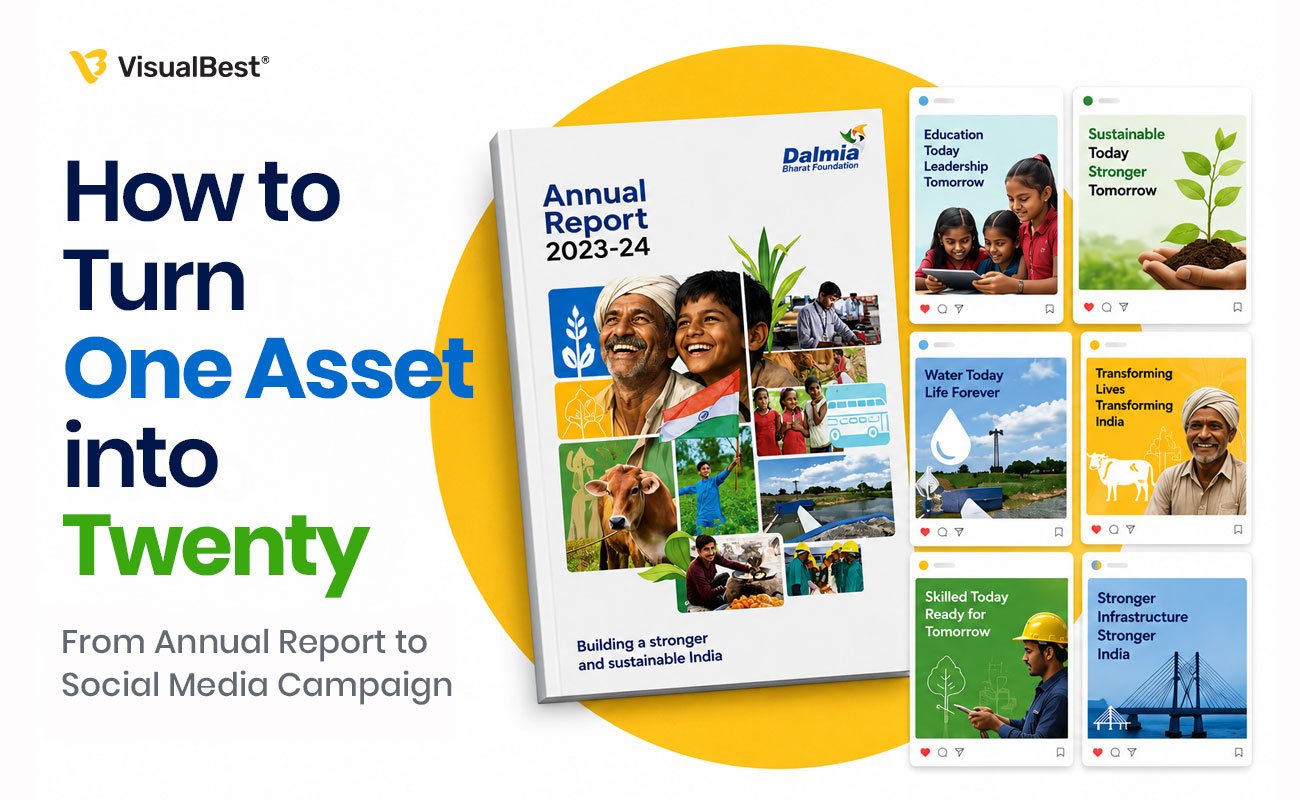
This is the most expensive content mistake corporate India makes in 2026, and almost nobody talks about it. Your annual report isn’t one asset. It’s twenty. The question isn’t whether to repurpose it. The question is why you aren’t already.
Why annual reports are the highest-ROI content asset most companies waste
Before the playbook, a quick reframe of what an annual report actually contains.
Strip away the investor-relations framing and a well-designed annual report is essentially a curated year’s worth of your company’s best content. Think about what’s in it:
👉 Financial highlights with real numbers, growth rates, and market context. This is data journalism nobody else in your category has.
👉 CEO and Chairman letters that took weeks to write and refine. These are thought-leadership pieces already approved by legal and communications.
👉 Business segment breakdowns with context on why each segment grew or slowed. This is category insight your competitors would kill to have.
👉 Sustainability and ESG metrics with real numbers on carbon reduction, workforce diversity, community impact.
👉 Product and innovation highlights describing what you launched, what worked, what’s next.
👉 Customer stories and case studies with named clients, specific outcomes, and quantified results.
👉 Employee testimonials, culture moments, and workplace highlights.
👉 Board and leadership team profiles with authentic photography and biographical context.
👉 Awards, recognition, industry rankings, and third-party validation.
👉 Long-term strategy articulated in language your leadership has personally approved.
Every one of those is premium social media content. Combined, they’re roughly what a well-run B2B social media team creates from scratch across an entire year. The annual report has already done that work. The company just doesn’t realize it.
The Playbook: 20+ social assets from one annual report
Here’s the specific breakdown of what to extract, in the order that typically works best in a corporate content calendar.
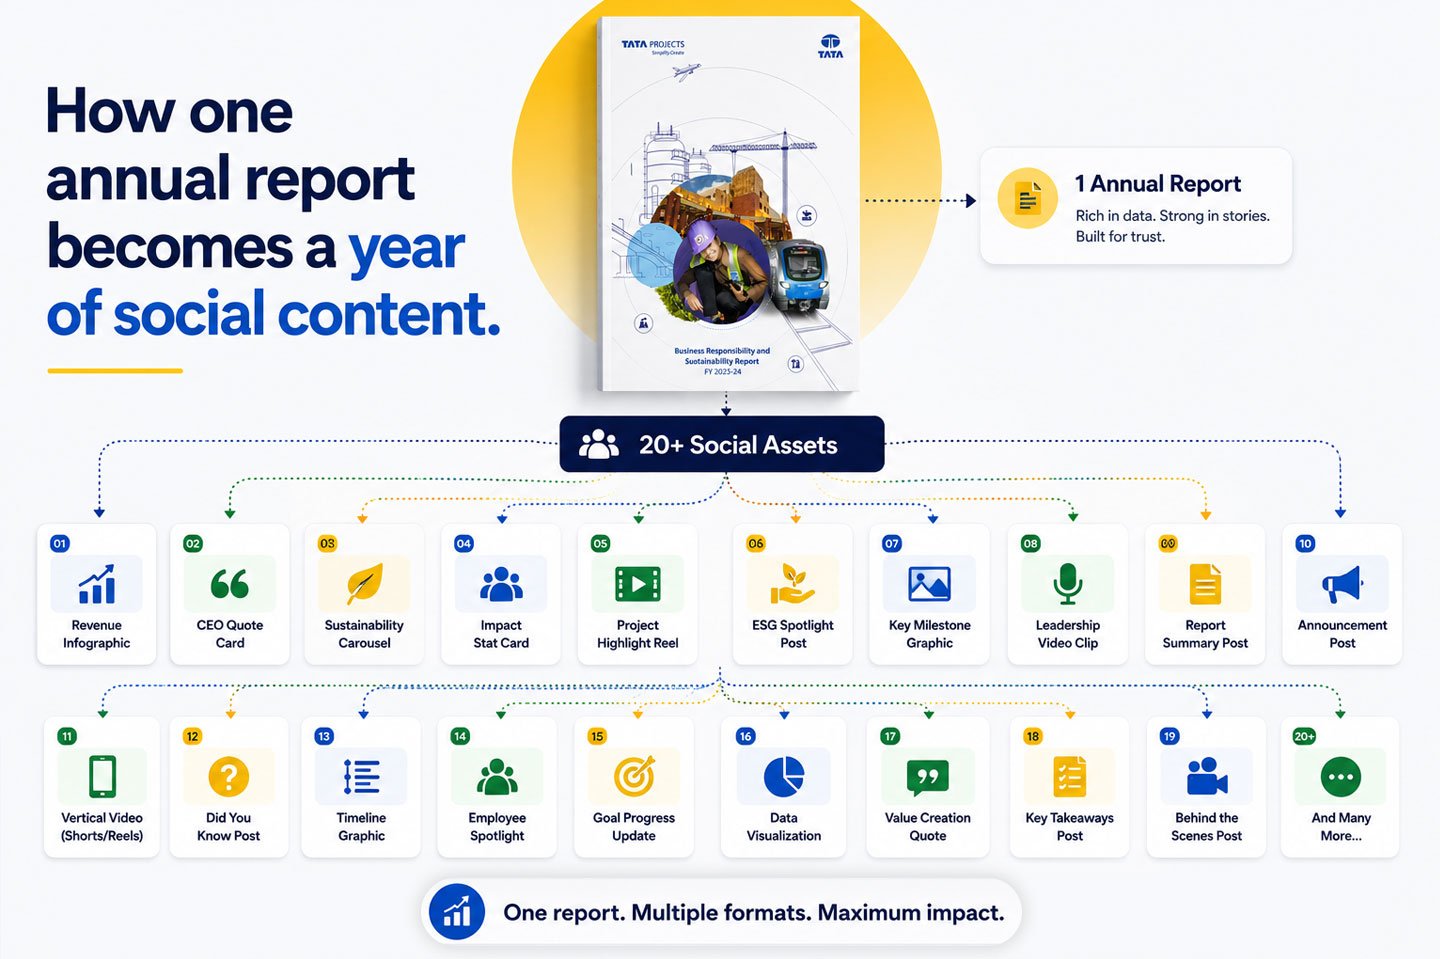
From the financial highlights section (4 to 6 assets)
- The headline revenue infographic. A clean visual showing YoY growth, quarterly breakdown, or segment contribution. LinkedIn loves this. Format: single-image post or short reel with animated data.
- The “did you know” data card. One surprising statistic pulled from the report, framed as a standalone insight. (“₹1,247 crore of our FY26 revenue came from products that didn’t exist three years ago.”)
- The market context carousel. Your growth number in context of industry averages, competitor performance, or macro trends. Educational content that positions your company against the market.
- The finance team spotlight video. A short-form video with your CFO or finance head explaining what the numbers actually mean in plain language. Humanizes what would otherwise be dry data.
- The five-year trend visualization. Historical data reframed to show long-term direction. Perfect for LinkedIn thought leadership.
From the CEO and Chairman letters (3 to 5 assets)
- The CEO video quote series. Pull three to five sharp insights from the CEO letter, film them as 30-second talking-head vertical videos. If you already have footage from board meetings or investor calls, use that.
- The Chairman perspective post. Longer-form LinkedIn post from the Chairman’s account, adapted from a specific paragraph in their letter.
- The strategic priorities carousel. The 3 to 5 strategic priorities your leadership identified, adapted as a scannable carousel. Excellent for LinkedIn and employer branding.
- The “year in review” thread. X or LinkedIn thread structure covering the year’s major moves, adapted directly from the CEO’s summary.
From business segment breakdowns (3 to 5 assets)
- The product line spotlight series. One post per major product or business line, showing what it did, why it grew, and where it’s going next. Great for both B2B and consumer brands.
- The geographic expansion story. If your report shows new market entries or international growth, this becomes a mini case study visible to potential partners and hires.
- The innovation timeline. Products or services launched during the year, shown as a visual timeline. Positions the company as forward-moving.
From sustainability and ESG sections (2 to 4 assets)
- The sustainability infographic. Your carbon reduction, water usage, waste diversion, or other environmental metrics visualized cleanly. Increasingly important for corporate reputation.
- The diversity metrics post. Workforce diversity numbers, promotion patterns, or leadership representation stats. Should link to specific programs you’re proud of.
- The community impact story. CSR programs, foundation work, or community engagement described in the report, adapted as a story-driven post with real photography.
From customer and case study sections (3 to 5 assets)
- The client success carousel. Any client whose logo appears in your report or whose case study is featured becomes a shareable social post. Get their approval first, then extract 5 to 7 key data points.
- The customer testimonial reel. Short-form video pulling customer quotes from the report. If you have raw video footage from the case study interviews, this is nearly free content.
- The “problem we solved” post series. Each customer story reframed as a “here’s a challenge our client faced and how we approached it” educational post.
From leadership, culture, and awards sections (3 to 4 assets)
- The leadership team introduction series. One post per leader with a photo, role, and one insight from their contribution to the report. Excellent employer branding content.
- The workplace culture reel. If the report includes office photography, team photos, or workplace descriptions, these become authentic culture content for recruitment and brand-building.
- The awards and recognition post. Any award, ranking, or recognition mentioned in the report becomes a social post. Third-party validation is high-trust content.
- The employee spotlight series. If the report profiles employees or their contributions, each becomes a dedicated post.
Take those numbers seriously. A single 60-page annual report can genuinely yield 20 to 25 social assets, each one usable across 2 to 3 platforms with minor format adaptation. That is 40 to 60 platform-specific posts from one asset you already paid to produce.
The mistake most companies make when they try this
The intuition to repurpose annual reports isn’t rare. Plenty of marketing teams know they should. The execution failure is where it breaks down. Three specific reasons this consistently doesn’t happen:
- Separate vendors, separate briefs, no continuity. The annual report is produced by a report design studio in a six-month engagement. Social media is handled by a different social media agency on a monthly retainer. The two vendors never speak to each other. Brand system knowledge doesn’t transfer. The social team can’t easily access the source files. The report becomes a dead asset the moment it’s approved.
- No structured extraction process. Even when marketing wants to repurpose the report, nobody has documented the extraction workflow. Which sections become which post types? Who approves the adaptations? How are the source visuals reused legally? Without a documented process, the intention dies in operational friction.
- Wrong internal owner. Repurposing sits between three functions: investor relations (who owns the report), corporate communications (who owns brand voice), and social media marketing (who owns publication). Everyone assumes someone else will drive it. Nobody does.
The result is what you’d expect: one of the most expensive content assets the company produces gets used exactly once, and the social team continues creating content from scratch in parallel.
What good execution looks like (a workflow to steal)
The companies that do this well have a specific operational pattern. If you’re building the workflow internally, here’s the structure that works:
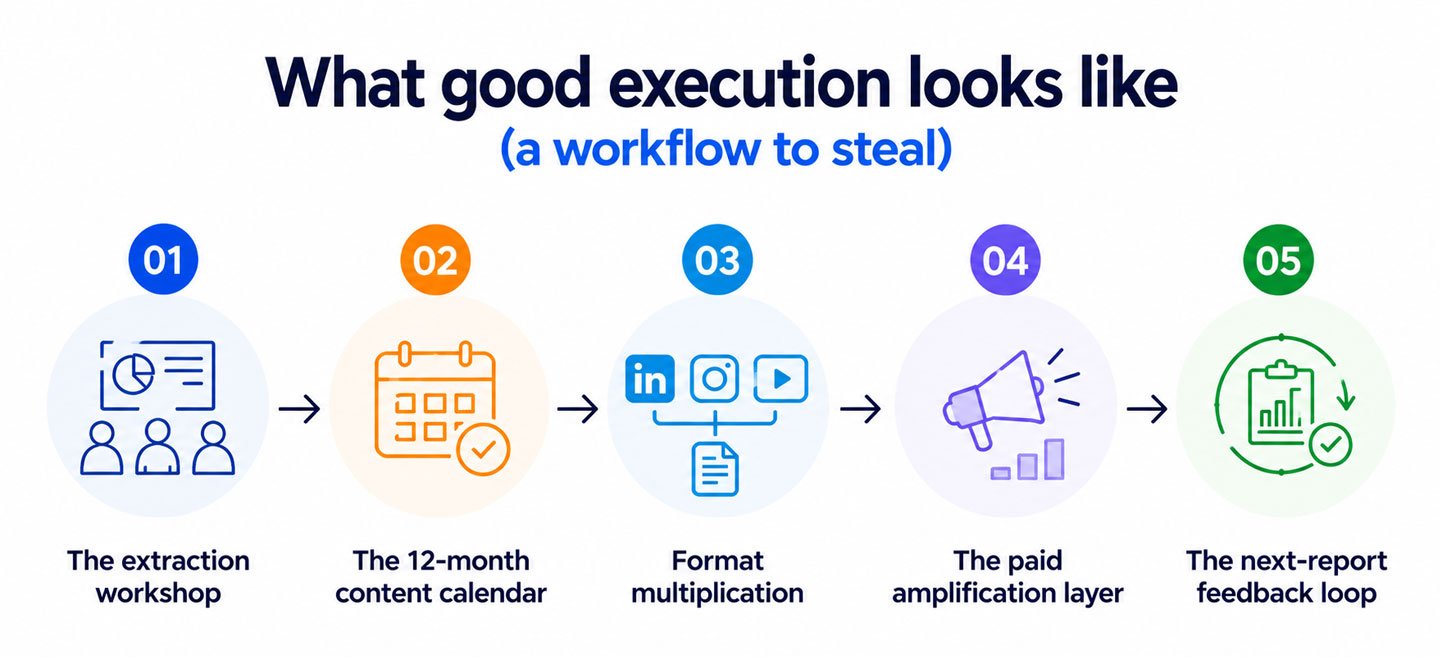
Step 1: The extraction workshop. Within two weeks of annual report publication, hold a 90-minute workshop with your report team, communications team, and social media team. Map every extractable asset from the report against your social calendar. Assign owners and deadlines.
Step 2: The 12-month content calendar. Sequence the extracted assets across the coming year. Financial highlights in the first two months post-publication. Sustainability content around your industry’s sustainability week or your reporting cycle. Culture content quarterly. Customer stories staggered monthly.
Step 3: Format multiplication. Each extracted asset gets adapted for three platforms minimum: LinkedIn (formal, thought leadership), Instagram (visual, engagement-focused), and short-form video (Reel or Short). One asset, three formats, three chances to reach different audience segments.
Step 4: The paid amplification layer. The strongest three to five extracted assets get paid promotion budget behind them. Since the assets are premium quality (leadership-approved, brand-perfect), they perform better in paid than typical social content.
Step 5: The next-report feedback loop. Track which extracted assets performed best. Feed that data back to the report team for the following year’s report, so future reports are structured for extractability from the start.
The last step is where the compounding value emerges. Companies that repurpose annual reports systematically start designing next year’s report with social extraction in mind, which makes both the report and the social program stronger.
Why one studio, not two, makes this work
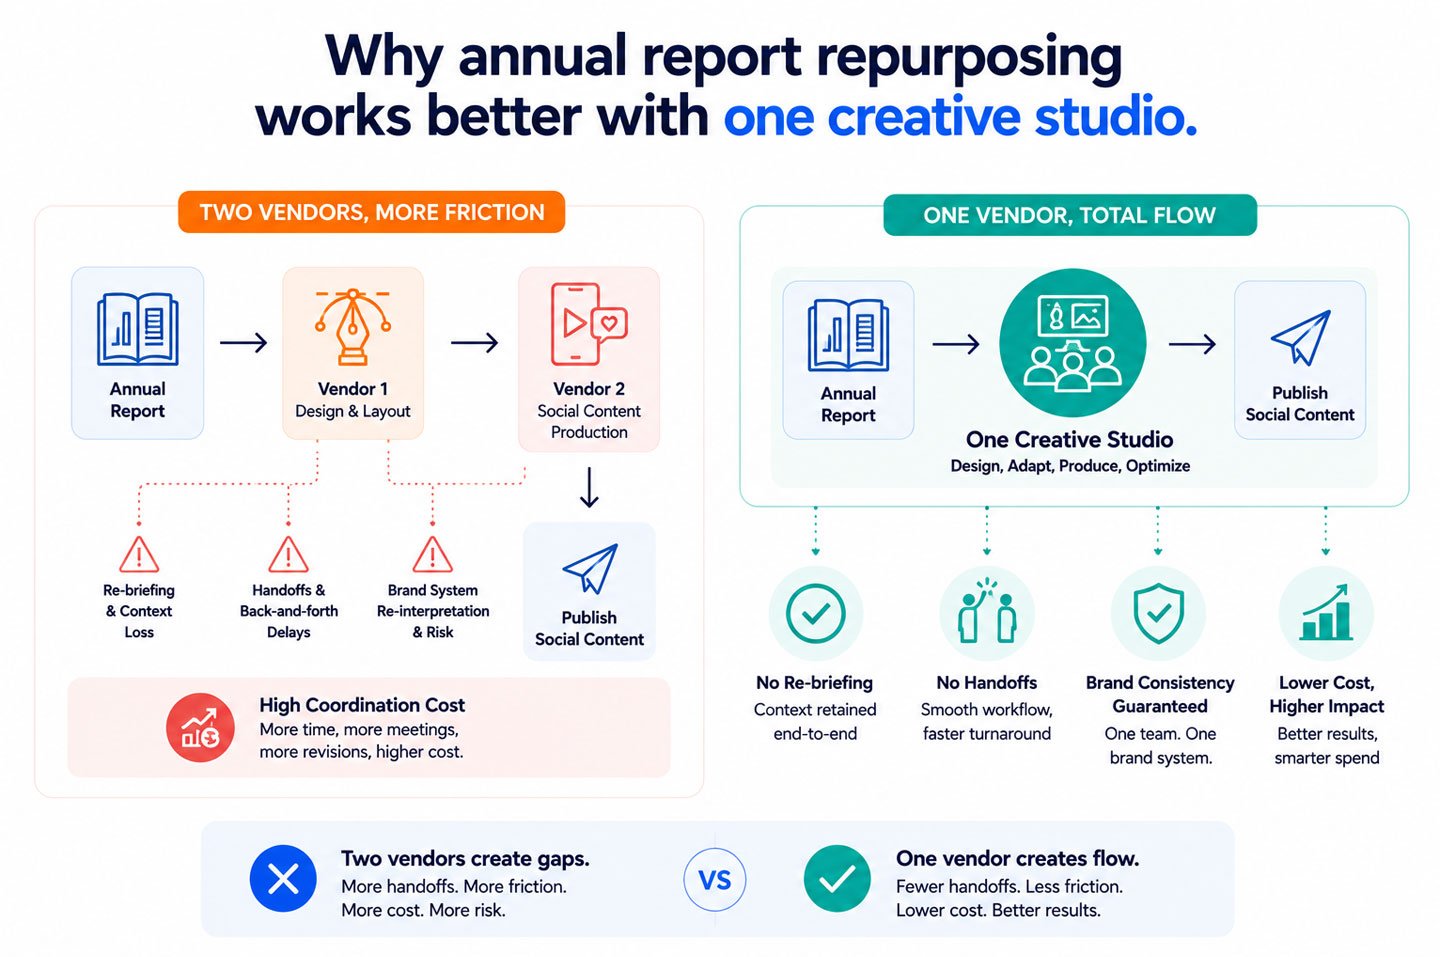
Here’s the part that quietly resolves most of the operational friction: this workflow is dramatically easier when the same creative studio produces both the annual report and the social media content.
Not because it’s impossible with two vendors. But because the specific mechanics of repurposing (source file access, brand system continuity, extraction workflows, format adaptation) all get faster and cheaper when one team owns the full picture.
An Annual Report Design Agency that designed your report knows exactly which data visualizations can be reformatted for social. The team that runs your social already understands your platform strategy and audience segments. When those two teams are the same team, you skip the brief-and-onboard cycle for every extraction, the source files are already in their hands, and the brand system stays coherent from report cover to social carousel.
This is where creative retainers become genuinely valuable rather than just efficient. A monthly retainer with a studio that handles both annual reports and social media creative is essentially buying the operational continuity that makes systematic repurposing possible. Without it, you’re managing two vendors, two brand systems, and two workflows, and the repurposing dies in the coordination cost.
Not every company needs this. If your annual report is small, your social program is light, or your teams already have deep coordination, project-based work with two vendors is fine. For enterprises producing meaningful annual reports and running active social programs, the consolidation math is compelling. See our creative retainer decision guide for the full framework on when this makes sense.
Frequently asked questions
How many social media assets can I actually create from one annual report?
Realistically, 20 to 25 distinct social assets per annual report, expandable to 40 to 60 platform-specific posts across LinkedIn, Instagram, and short-form video formats. That’s roughly a year of content from a single report.
Isn’t repurposing content just reposting the same thing?
No. Repurposing is strategic adaptation, not duplication. Each extracted piece of content is reformatted, reframed, and often reworked for the specific platform and audience segment. A LinkedIn thought leadership post from a CEO letter looks nothing like an Instagram carousel from the same source, even though both draw from the same paragraph.
What kinds of assets extract best from annual reports?
Financial data visualizations, CEO and Chairman quotes, sustainability metrics, customer case studies, product timelines, awards, and workplace culture content are the highest-ROI extractions. Case studies and financial data typically perform strongest on LinkedIn; culture and workplace content perform strongest on Instagram.
Do we need permission from clients whose stories appear in the report?
Yes. Any client mentioned in the report should be re-cleared before extracting their story for social. Most clients agree readily since the exposure benefits both parties, but this cannot be skipped.
How much does it cost to run a full extraction program?
For a mid-market brand, ₹40,000 to ₹1,20,000 monthly typically covers the design and adaptation work if you already have the report. This is often 30 to 50 percent cheaper than commissioning new social content from scratch, since the underlying strategy and approvals are already done.
Can AI tools do this extraction automatically?
Partially. AI can suggest extraction opportunities, generate first-draft adaptations, and assist with format multiplication. But strategic decisions about which assets to prioritize, how to reframe them for each audience, and how to sequence them across a calendar still require human creative direction.
Is this only relevant for listed companies with formal annual reports?
No. Any company producing a substantial annual asset (an annual report, a research whitepaper, a State of the Industry report, a founder’s letter, a State of the Company internal document) can apply this playbook. The principle is: any substantial content asset should feed the social program, not sit as a one-time publication.
Related reading
📖 When Does a Creative Retainer Actually Make Sense?, the retainer decision framework, since consolidation across services is exactly what makes retainers pay off.
📖 Best Annual Report Design Agency in India (2026 Guide), who to call when your report is due for a rethink.
📖 Social Media Creative Design Cost in India 2026, what monthly social media production actually costs.
📖 Best Social Media Design Agencies in India 2026, the social side of the two-service equation.
📖 8 Best Annual Report Design Examples 2026, what strong annual reports look like in 2026.